What Are Trading Signals?
Trading signals are alerts—either visual or numeric—that suggest potential market entry or exit points. They distill complex market data into actionable insights, helping traders seize opportunities without sifting through raw charts.

Definition and Core Concepts
At their essence, trading signals highlight moments when certain conditions, such as price thresholds or indicator crossovers, are met. These conditions are typically based on technical studies, statistical models or even sentiment analysis.
Manual vs. Automated Signals
- Manual Signals: Generated by experienced analysts who interpret charts and news flow.
- Automated Signals: Produced by algorithms running in real time on platforms like MetaTrader 4 or proprietary systems.
Sources of Trading Signals
- Commercial Signal Services (free and subscription-based).
- Broker-Provided Alerts (often bundled with premium accounts).
- Open-Source Indicators found on communities like TradingView.
- In-House Models, built by institutional desks or quant teams.
Examples of Popular Trading Signals

Below are widely used signals that serve as the backbone for many strategies:
Moving Average Crossover
When a short-term moving average (e.g., 50-period) crosses above or below a longer-term one (e.g., 200-period), it can indicate a shift in market momentum.
RSI (Relative Strength Index)
Values above 70 often suggest overbought conditions; below 30, oversold. Traders watch for reversals around these thresholds.
MACD (Moving Average Convergence Divergence)
A signal line crossover or divergence from price can hint at strengthening trends or upcoming reversals.
Bollinger Bands Breakouts
Price moves outside the bands signal high volatility—potential breakouts or false alarms.
Fibonacci Retracement Levels
Key retracement points (23.6%, 38.2%, 61.8%) can act as support/resistance, guiding entry and exit.
Volume-Based Signals
Sudden spikes or drops in traded volume often precede sharp price moves or reversals.
Price Action Patterns
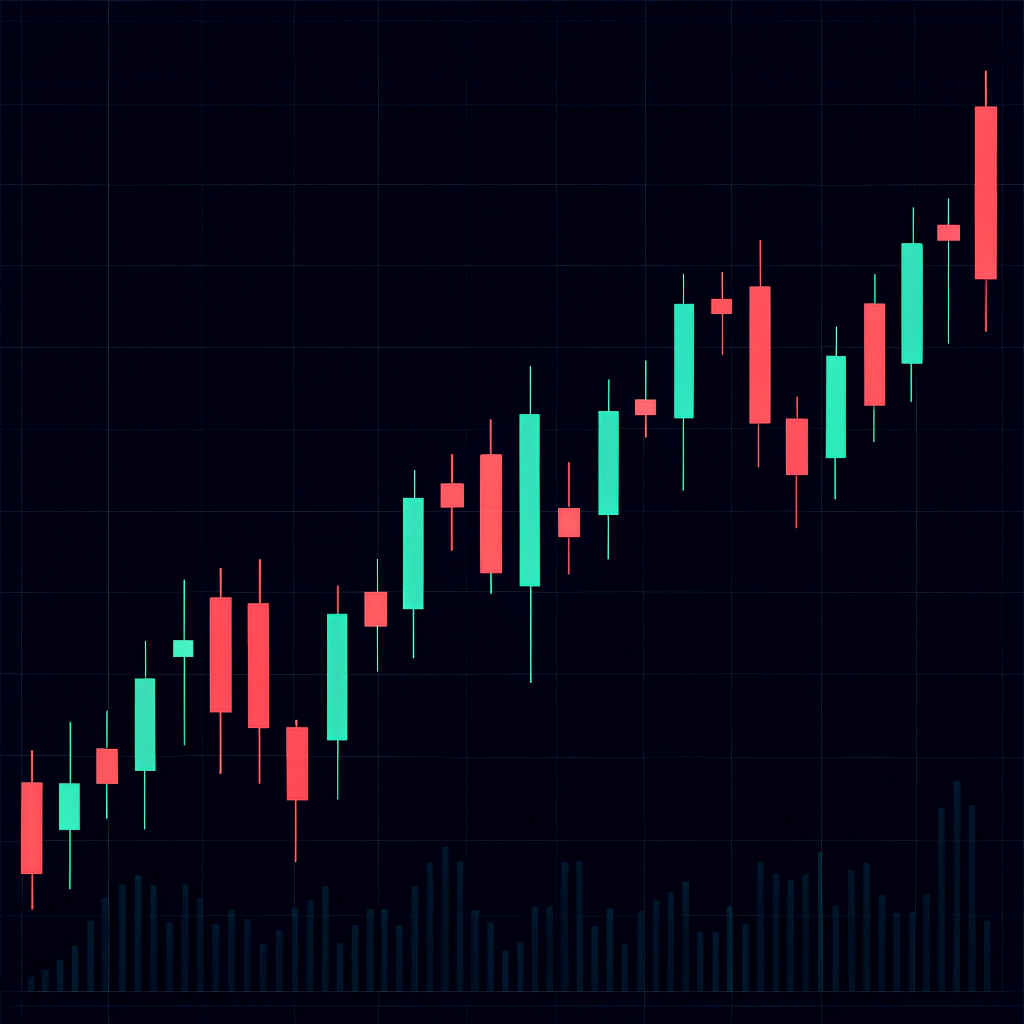
Candlestick formations such as pin bars, engulfing candles, or head-and-shoulders shapes carry predictive power.
News and Economic Events
Scheduled releases (e.g., non-farm payrolls) or unexpected headlines can trigger algorithmic signals tied to volatility thresholds.
How to Analyze and Interpret Trade Signals
Turning a raw alert into a high-probability trade requires a multi-layered review process.

Technical Analysis Integration
Combine your signal with trendlines, support/resistance levels, and chart patterns to validate its credibility.
Fundamental Considerations
Check earnings reports, macroeconomic data, or central bank statements for underlying drivers that support — or contradict — the signal.
Confirming Signals with Multiple Indicators
Using two or three distinct studies (e.g., RSI + MACD + volume) reduces the chance of false positives.
Timing and Market Conditions
Consider session-specific volatility (e.g., London open, New York close) and avoid chasing signals in thinly traded timeframes.
How to Turn Trading Signals into Profits
Signal generation is just step one; execution and management are what make (or break) your P&L.
Creating a Profitable Trading Plan
Draft clear rules: What triggers an entry? When will you exit? How will you size positions? Record these in a trading journal.
Position Sizing and Money Management
Use fixed-percentage risk per trade (commonly 1–2% of account equity) to protect capital during drawdowns.
Risk-Reward Ratio and Trade Setup
Aim for setups offering at least a 1:2 reward-to-risk. If your stop-loss is 20 pips, target 40 pips or more.
Entry and Exit Strategies
Consider layered entries (scaling in) and partial exits to lock in profits and reduce stress on trailing stops.
Choosing the Right Signal Providers
Not all sources are created equal — vet performance, transparency, and support carefully.
| Feature | Free Providers | Paid Providers |
| Cost | $0 | $30–$200+ per month |
| Historical Accuracy Data | Often limited or unverified | Comprehensive backtests |
| Support and Education | Basic community forums | Dedicated account managers |
| Customization | Low | High (API access, alerts) |
Free vs. Paid Providers
Free signals can be a good starting point, but paid services typically disclose detailed track records and offer real-time support.
Accuracy and Historical Performance
Look for verified statements on drawdown, Sharpe ratio, and win rate. Avoid providers with vague “up to 90% win rate” claims.
Reputation and Reviews
Seek out unbiased reviews on forums like ForexFactory and ask for client testimonials before committing.
Pros and Cons of Using Trading Signals
| Advantages | Disadvantages |
| Saves time on analysis | Potential for false or delayed signals |
| Provides guidance for novice traders | Over-reliance can hamper skill development |
| Access to professional-grade insights | Subscription costs can add up |
| Enables diversification across multiple assets | May conflict with your personal bias |
10 Expert Tips for Profitable Signal Trading
- Vet Signal Sources Carefully
Investigate track records and request third-party verification. - Learn Before You Follow
Understand the logic behind each alert rather than blindly executing. - Combine with Technical and Fundamental Analysis
A holistic approach boosts conviction. - Always Apply Risk Management Rules
Never risk more than you can afford to lose. - Don’t Trade Every Signal
Filter for the highest-probability setups aligned with your plan. - Use a Demo Account for Testing
Validate new strategies without risking real capital. - Monitor Market Conditions
Stay aware of upcoming data releases or geopolitical events. - Review Trade Outcomes Regularly
Analyze winners and losers to refine your methodology. - Avoid Emotional Decision-Making
Stick to your rules — even when a big opportunity tempts you. - Keep a Trading Journal
Document rationale, outcomes, and lessons learned.
Building Your Own Signal-Based Strategy
Crafting a bespoke system ensures alignment with your risk tolerance and goals.
Define Entry and Exit Criteria
Specify indicator thresholds, candlestick patterns, or volume triggers.
Set Risk Parameters
Determine maximum drawdown tolerances and trade allocation limits.
Backtest and Optimize
Use historical data (e.g., via QuantConnect) to assess robustness.
Combine Technical and Fundamental Insights
Blend quantifiable indicators with macro-level research for a diversified edge.
Frequently Asked Questions (FAQ)
Are trading signals reliable for beginners?
They can accelerate learning, but novices must still grasp underlying concepts to avoid blindly following bad advice.
How do I choose a trustworthy signal provider?
Look for transparency, verified performance reports, and responsive customer support.
Can I automate my trades using signals?
Yes — many platforms allow API integration or expert advisors (EAs) to translate alerts directly into orders.
What are the risks of relying on signals?
Market conditions can change rapidly, making some signals obsolete; plus, over-dependence may stunt skill growth.
How can I improve signal accuracy?
Layer multiple indicators, adjust parameters to current volatility regimes, and keep abreast of economic developments.


